Hover a mouse pointer over the Reporting menu link to display its drop-down menu.
Click Business Intelligence to open the Business Intelligence screen.
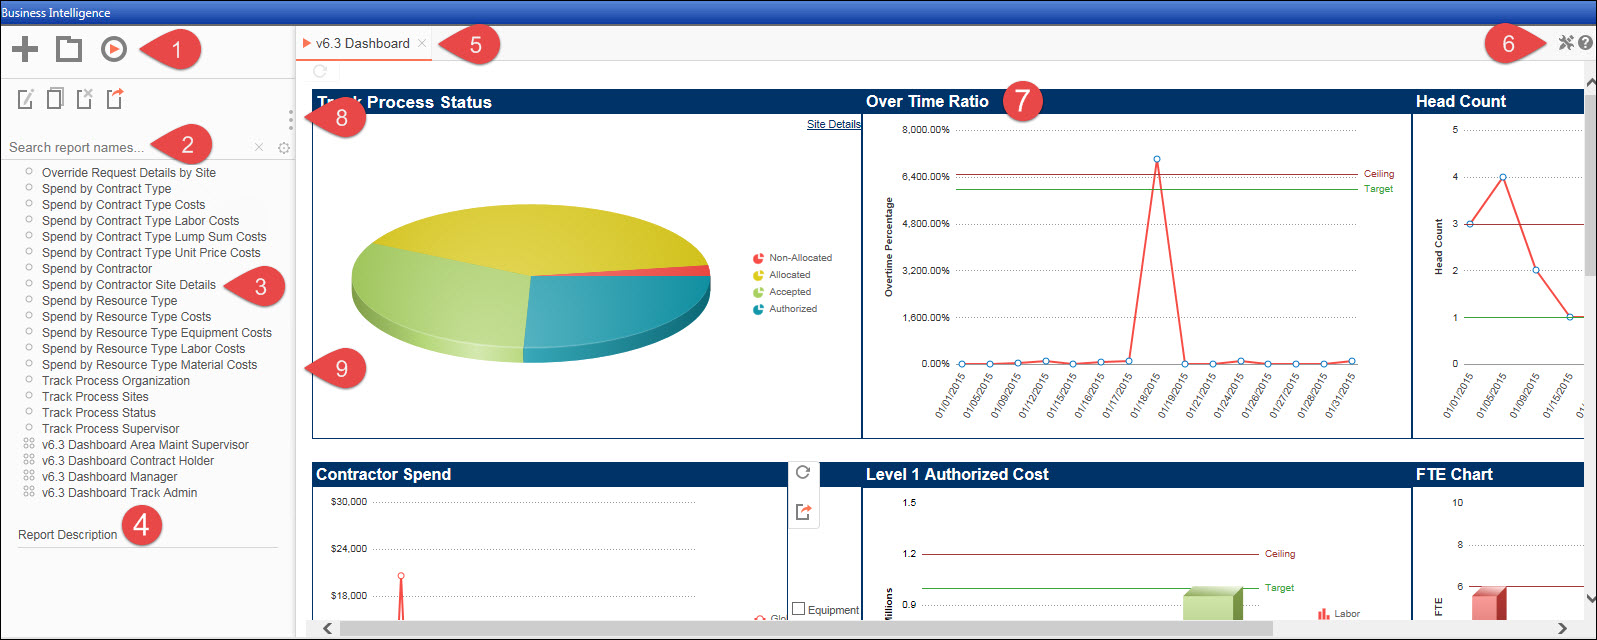
Once the Business Intelligence screen opens, it displays in a frame format: left and right frames.
Left Frame
Main Menu: displays tools to create, run, edit, duplicate, delete, or export reports and manage folders.
Search report names: search for available analytic reports.
Dashboards and Reports: the available dashboards and reports are displayed, depending on the user's profile rules.
Report Description: description of selected report, when applicable.
Right Frame
Tabs: displays selected dashboard or report name.
Change User Preferences icon:
opens the User Preferences pop-up screen allow the user to change
the start up or user reports.
Help icon: launches the context-sensitive
Help.
Dashboard Designer:
displays selected dashboard or report which allow users to create
or edit.
Report Viewer: displays selected
reports in the design grid or the context-sensitive Help.
Welcome to Track Business Intelligence
is the default screen and is displayed if the dashboard or report
is not open.
Other Features
Splitter Icon: click the splitter icon to hide or display the Left Frame.
Separator: press and hold the mouse on the separator (the vertical line which separates the Left and the Right Frames) then drag it to the left or the right to resize the frames.